Key takeaways
- Rank value comes from three multiplied numbers: search volume, click-through rate at position, and the revenue per visitor behind it.
- Published CTR curves are directional averages, not facts about your SERP. Use your own Search Console data whenever you have it.
- The honest model subtracts your existing traffic — you are buying the delta between where you rank now and where you would rank.
- Payback period matters more than annual return, because it is what determines whether the programme survives long enough to work.
The formula, in one line
Strip away the dashboards and every SEO business case reduces to the same multiplication:
Monthly value = monthly searches × (CTR at target position − CTR at current position) × conversion rate × value per conversion
Four inputs. Each one is estimable, each one is arguable, and the credibility of your whole business case rests on how honestly you handle the arguable parts. Let's take them one at a time.
Step one: click-through rate by position
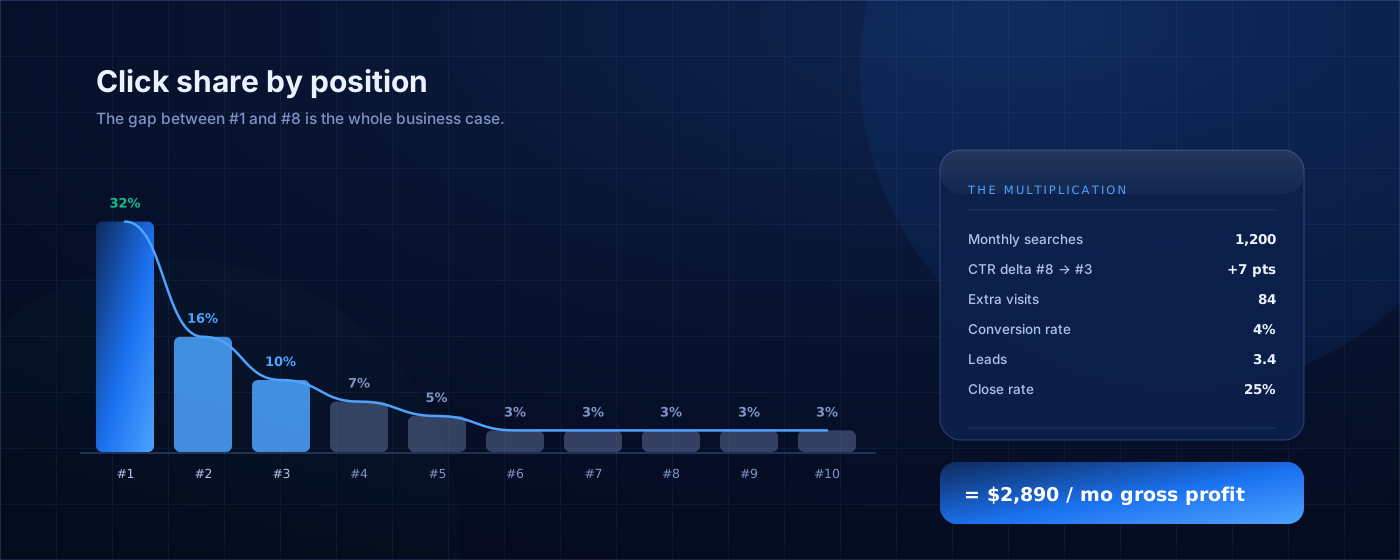
This is the number everyone quotes and almost nobody sources properly. Published click-through-rate curves — the ones showing position one taking roughly a third of clicks and position five taking a twentieth — come from large aggregate studies across millions of queries. They are directionally useful and specifically wrong for your site.
The model behind our ROI calculator uses a curve in that shape:
| Position | Approximate share of clicks |
|---|---|
| 1 | ~32% |
| 2 | ~16% |
| 3 | ~10% |
| 4 | ~7% |
| 5 | ~5% |
| 6–10 | ~3% each |
| 11–20 | ~1% each |
Treat that as a starting point you replace as soon as possible. The real curve for any given query depends on how much of the page the organic results still own. A SERP with four ads, a map pack, a shopping carousel and an AI Overview above the first organic result behaves nothing like a clean ten-blue-links page, and the gap between them is far larger than the gap between position one and position three.
Branded versus unbranded
Keep them apart. Branded queries convert several times better and click through at rates no unbranded curve will ever match, because the searcher already decided. Mixing them into one average inflates the model and hides the fact that your unbranded acquisition may be flat.
Step two: the volume that actually applies to you
Keyword tools report national or metro-level volume. If you are a service business in Atlanta, the number you care about is the slice of that volume inside your service area with intent you can serve.
- Geography. A tool reporting 8,000 monthly searches for a term across the US might represent a few hundred in metro Atlanta.
- Intent. "How does a heat pump work" and "heat pump installation Atlanta" may sit in the same cluster and have wildly different commercial value. Value them separately.
- Seasonality. Annual averages hide the fact that half of some categories' demand lands in two months. Model the shape, not the mean.
- The long tail. Your head term is a fraction of the traffic a well-built page earns. A page ranking for one target keyword typically picks up dozens of related queries, and leaving those out is the most common reason a model undershoots reality.
Step three: what a visitor is worth
Two numbers: what share of visitors convert, and what a conversion is worth.
The conversion rate should come from your analytics, segmented to organic landing pages — not a site-wide average diluted by branded and direct traffic. If your tracking cannot tell you that, fixing measurement is a higher-priority project than any ranking work, because you are about to make budget decisions on numbers you cannot verify.
For value per conversion, use gross profit rather than revenue, and use lifetime value rather than first-transaction value where you have retention data. A $400 first job at a business with a 40% margin and three repeat visits is not a $400 conversion in either direction — it is $160 today and considerably more over the relationship.
Step four: subtract what you already have
Here is where most agency projections quietly cheat. They calculate the value of the traffic at position one and present it as the return, when what you are actually buying is the difference between your current position and your target.
If you sit at position six today, moving to position two does not deliver the value of position two — it delivers the value of position two minus the value of position six. On a 2,000-search term that is a meaningful business case. Presented the other way, it is roughly double, and the first time reality lands it costs you the client's trust in every number that follows.
A worked example
An Atlanta commercial cleaning company, one term, honest inputs:
| Input | Value | Where it came from |
|---|---|---|
| Monthly local searches | 1,200 | Keyword tool, filtered to metro |
| Current position | 8 | Rank tracker, 90-day average |
| Target position | 3 | Realistic given competitor authority |
| CTR delta (3% → 10%) | +7 pts | Own Search Console bands |
| Extra monthly visits | 84 | 1,200 × 7% |
| Organic landing page conversion | 4% | GA4, organic segment only |
| Leads per month | 3.4 | 84 × 4% |
| Close rate | 25% | CRM |
| Average contract gross profit | $3,400 | Finance, annualised, margin-adjusted |
That is roughly 0.85 new customers a month, worth about $2,890 in gross profit — from a single keyword. Around $34,700 a year, against an engagement in the $1,500–$3,000 a month range. It pays back, but not in month one, and the model is only defensible because every input traces to a source.
Now do the same arithmetic across a cluster of thirty related terms, which is what an actual content programme targets, and you have a business case rather than a hopeful chart.
Four ways this model goes wrong
1. It assumes you reach the target position
Nothing in the formula accounts for the probability of getting there. A term where the top three results are national directories with thousands of referring domains is not a three-to-six-month project for a local business, and pretending otherwise is the single most common failure in SEO forecasting. Weight each term by a realistic difficulty-adjusted probability, or model a range instead of a point.
2. It ignores the time cost of money
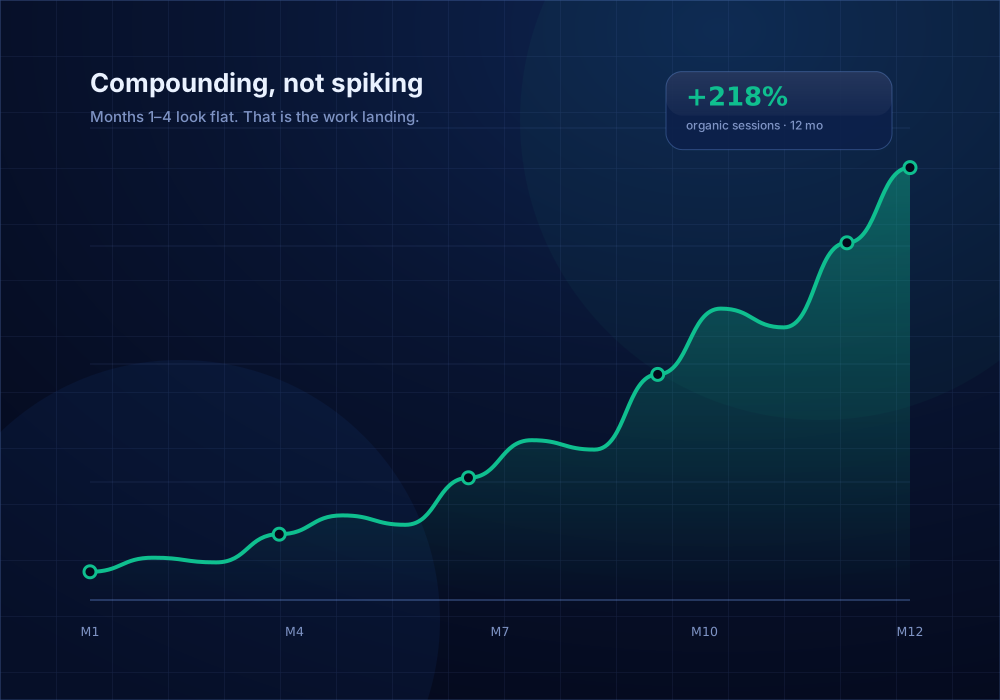
SEO returns arrive late. Content published in March may not reach its ranking until August. A model showing annual return without showing the monthly curve hides the six months of spend before anything appears — which is the number that actually determines whether the programme gets cancelled.
3. It treats the SERP as static
The share of searches ending without a click has been rising for years, and AI Overviews accelerate it in informational categories. If your target terms are the kind an AI answers directly, discount the CTR curve accordingly and shift weight toward being cited in the answer rather than ranking beneath it.
4. It counts rankings instead of revenue
Rankings are a proxy. If your measurement setup cannot follow an organic session through to a closed deal, every number above is an estimate stacked on an estimate. Fix attribution first; it costs less than a month of content and it makes every subsequent decision cheaper.
Turning the number into a business case
A credible SEO business case has four parts, and the model above is only the first:
- The estimate, with every input sourced and a stated range rather than a single number.
- The payback period, month by month, including the months at zero.
- The comparison, against what the same budget buys in paid search — including the fact that paid stops the day you stop paying and organic does not.
- The kill criteria, agreed up front: what you expect to see by month three, and what you will do if you do not see it.
That fourth point is the one that separates an SEO programme that survives a budget review from one that does not. Committing in advance to what failure looks like is what earns the room to keep going when the early months look flat — which, if the work is being done properly, they will.
You can run the arithmetic on your own numbers with our SEO ROI calculator, or send us your site and we will build the model with you.